

ACCELERATING BLUE CARBON
How to Ignite a Blue Carbon Mass Mobilization
Blue Carbon Chapter

Blue Carbon Chapter Intro Video
Learn about Blue Carbon strategies that restore and protect carbon to coastal and ocean ecosystems can create cascading benefits. Hear from Kevin Bayuk of LIFT Economy, and find ways to continue to engage as this movement grows. On YouTube

Blue Carbon Chapter Download
Download the Blue Carbon chapter, originally published Fall 2019.
Introduction
This is the first prototype chapter of the Co-Operating Manual for Spaceship Earth. We aim to have thousands of chapters collating resources on how to create a cooperative future.
This site is companion to our full research report on Accelerating Blue Carbon. Download the pdf.
The Co-Operating Manual for Spaceship Earth is under development and we would love your input as we continue to iterate on its design. Please share your thoughts with us on what you like about this page and what you wish was here. Thank you for Co-Operating with us.
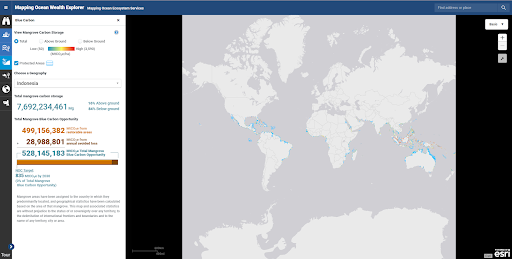
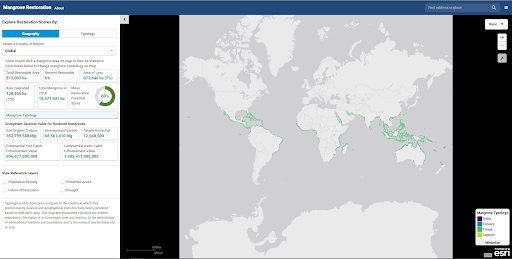
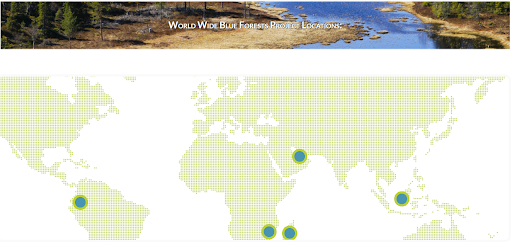
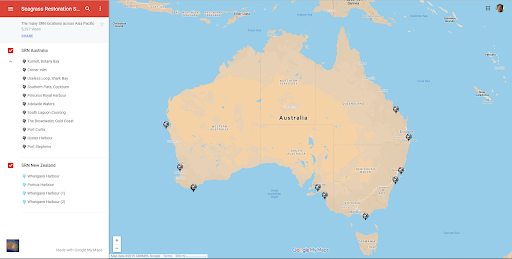
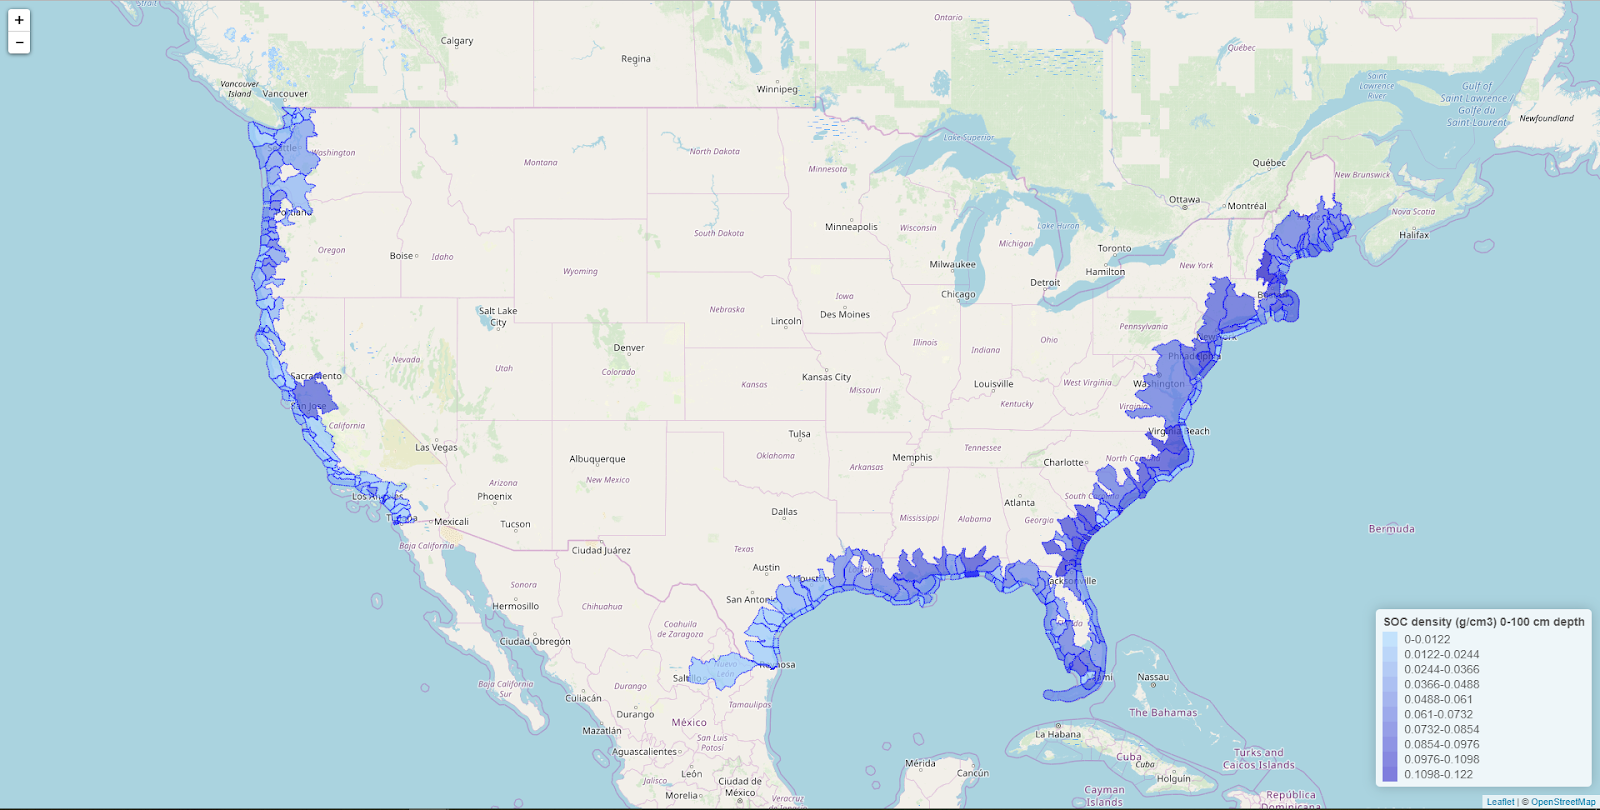
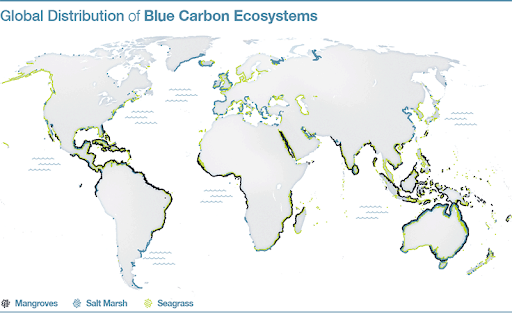
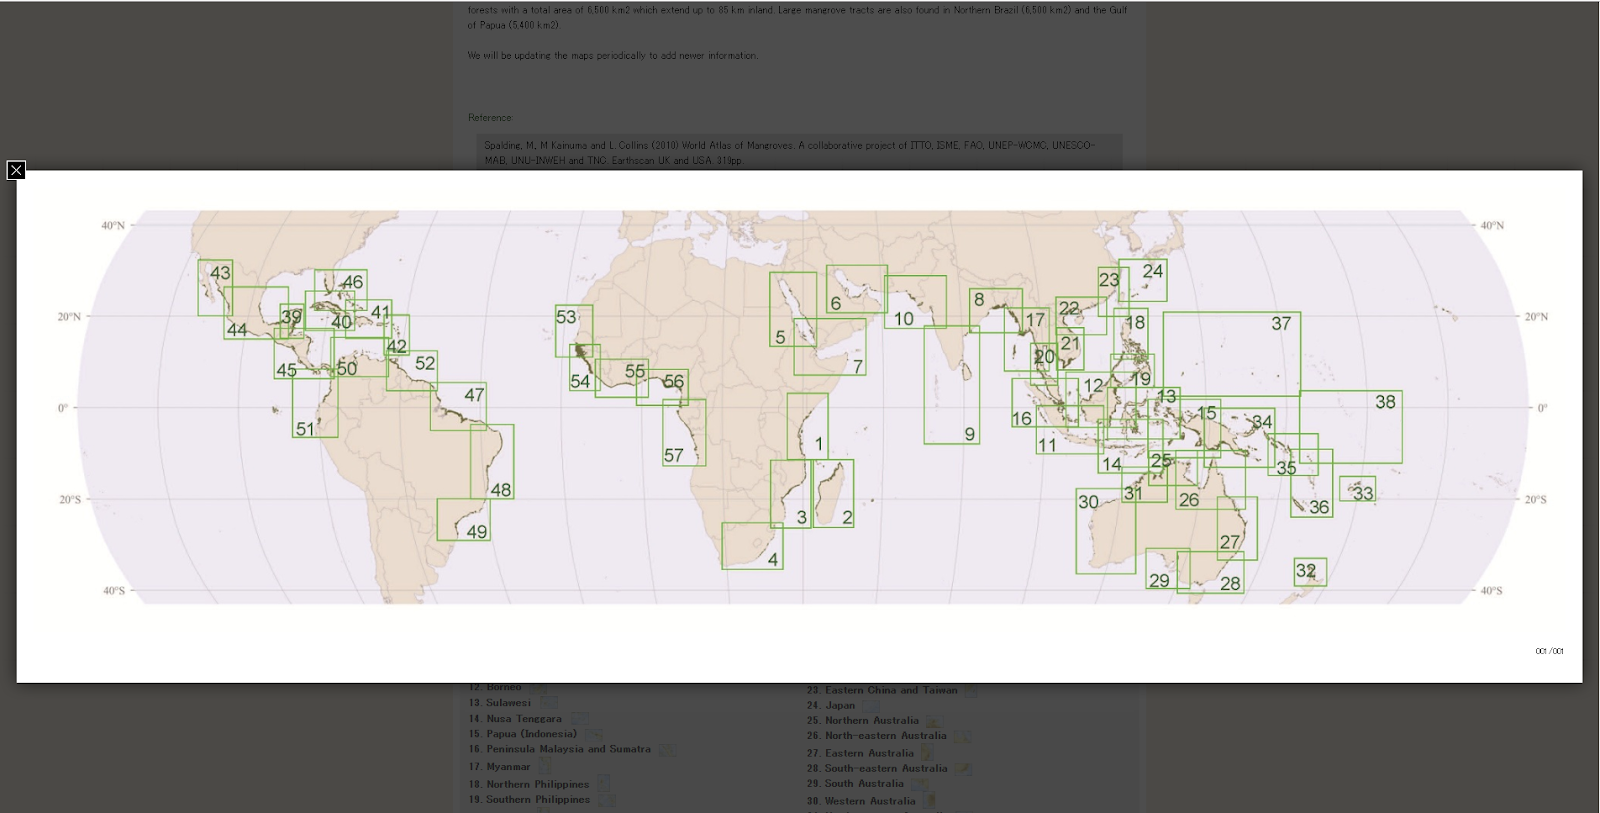
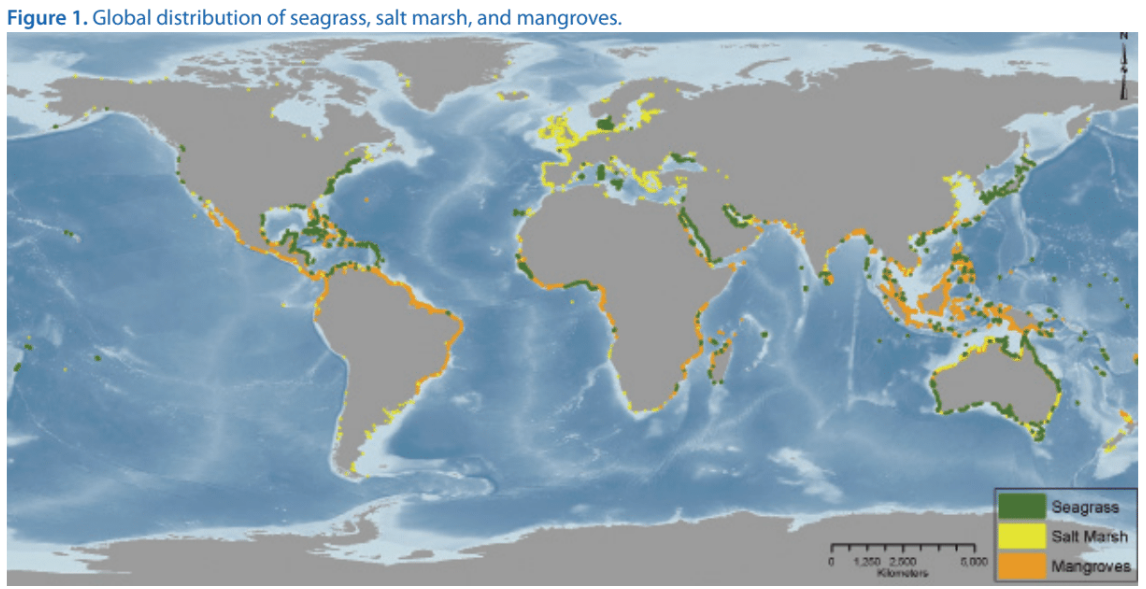
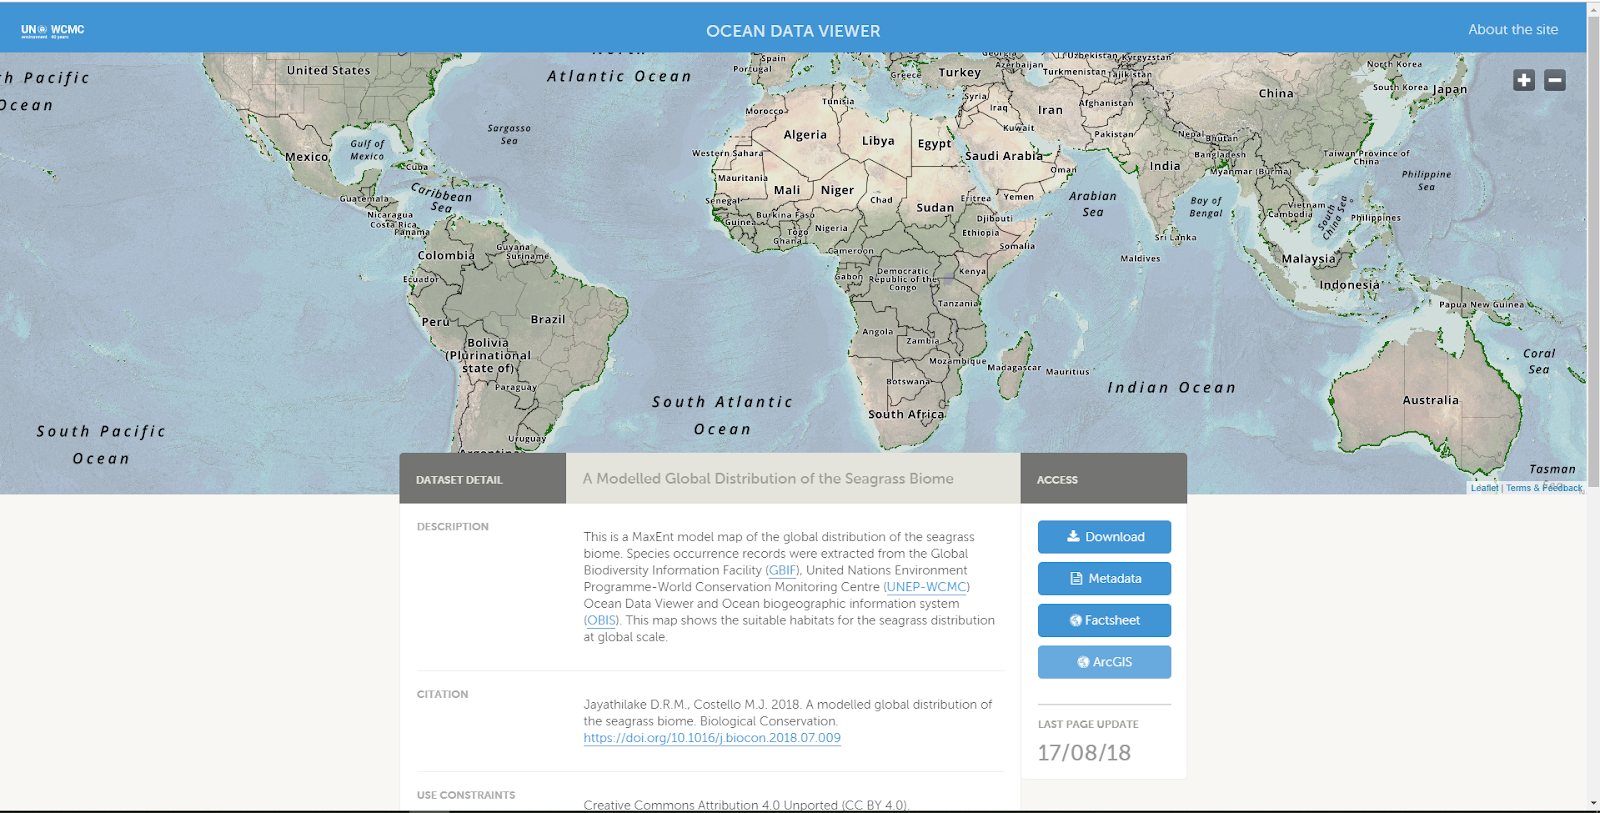
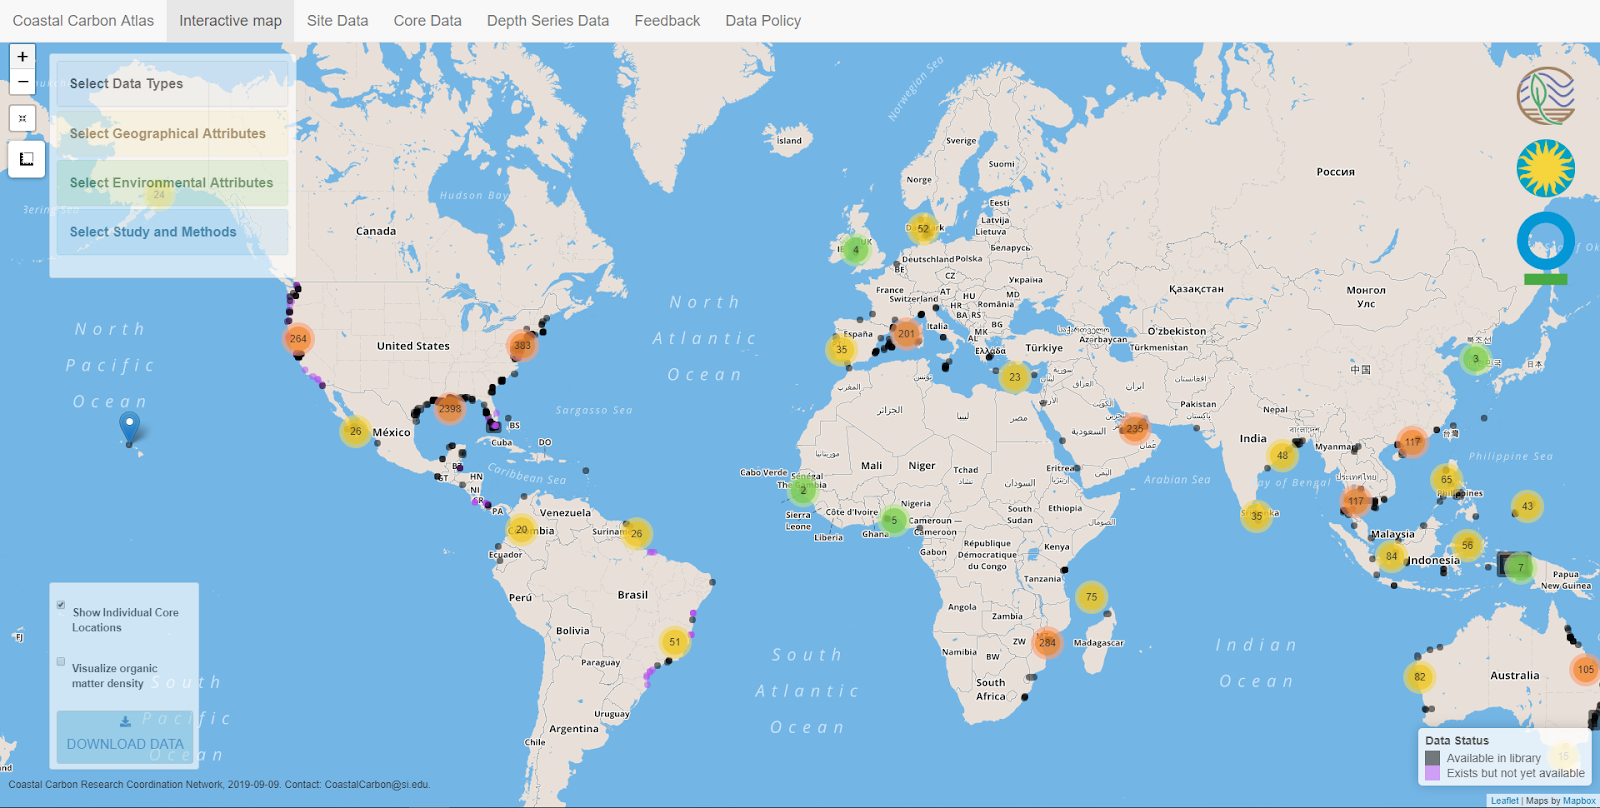
Blue Carbon Map Carousel
There are a diversity of maps that exist that geolocate a diversity of aspects of the Blue Carbon universe. Here are a number of maps you can click through to enhance your understanding.

Summary of Big Ideas

PHOTO: Mohamed Sameeh
THE STATE OF BLUE CARBON RESEARCH
Our ocean deeply influences the global carbon cycle through coastal blue carbon (mangroves, seagrasses, macroalgae and salt marshes) and oceanic blue carbon (phytoplankton, marine animals, and other open ocean biota) mechanisms. It has been 10 years since the term “blue carbon” was coined (2009) and although the importance of these ecosystems and mechanisms is not yet entirely understood, many of the conclusions posited in the first blue carbon published research have been continually affirmed and refined including the following:
Whereas open ocean surface phytoplankton capture carbon from the atmosphere via photosynthesis, only a relatively small but important fraction of that carbon sinks all the way to the deep sea floor without being respired back to the atmosphere. Geoengineering schemes to stimulate phytoplankton growth and carbon burial are still burdened with controversy, uncertain outcomes and efficacy.
Key coastal ecosystems (mangroves, seagrass meadows and salt marshes) have outsized carbon burial rates compared to terrestrial ecosystems with important long-term carbon storage potential.
These coastal ecosystems also provide significant co-benefits to coastal communities including mitigating impacts of sea level rise and extreme storms while providing diverse goods and services.
These key ecosystems are endangered and urgently threatened by pollution run-off from land, urban development, aquaculture and overfishing. When disturbed these ecosystems emit stored carbon and lose their capacity to sequester carbon.
Despite being critically important to biodiversity and coastal community food security, coral reefs do not act as carbon sinks, but in fact are modest carbon sources due to the chemistry of their growth.
Over the last decade research published in hundreds of papers has revealed some new key insights relevant to our collective understanding of and partnership with blue carbon ecosystems including the following:
Emergent techniques of local community-led conservation and restoration of the key blue carbon ecosystems (especially mangroves) can preserve and enhance coastal community food security and material economy while creating or maintaining carbon capture and coastal protection benefits.
Formerly thought of as modest stores of labile carbon (easily consumed by other organisms and thus respired back to the atmosphere), macroalgae (kelp bed) ecosystems are increasingly recognized as critical contributors to long term blue carbon capture.
Ocean farming techniques to create or reforest macroalgae ecosystems have emerged with carbon mitigation and sequestration potential.
The mechanisms by which marine vertebrates (fish, whales, etc.) impact oceanic blue carbon capture and deposition have been identified and begun to be measured. Whales, in particular, appear to play an outsized role in stimulating the productivity and sink capacity of open ocean phytoplankton.
While still not totally known, the extent of existing and potential seagrass meadow ecosystems has been assessed as much larger than earlier thought pointing to significant carbon capture potential as emergent lower cost techniques for establishment and restoration are tested and developed.
While potentially controversial, novel blue carbon ecosystems can be created in certain places where drawing in seawater to arid inland regions can create significant carbon capture processes and food security benefits or in the open ocean where artificial macroalgae ‘reefs’ are proposed.
Best practices for developing and funding blue carbon projects have begun to emerge. Key strategies focus on emulating and restoring cultural practices that result in beneficial human impact and interaction with our oceans. The Japanese concept of Satoumi, which describes coastal landscapes positively impacted through human - oceanic interactions for long timescales, like many other indigenous philosophies, can act as guidelines. Best practices are primarily focusing on mangroves, seagrasses, macroalgae (kelp) and oceanic blue carbon (including whale pump and biomixing). These also make up the most “actionable” blue carbon ecosystem initiatives, based on an analysis by Lovelock, et al., and are self-evidently ready to enhance carbon capture and ecosystem health now.
There still exists a “charisma” gap for blue carbon. Whereas the loss of terrestrial rain forests has captured popular attention, the world is losing its coastal habitats four times faster. Action is being taken, but needs to be scaled to match the magnitude of the crisis.
Trim Tabs - Key Actions
A mix of offensive and defensive, restoration and conservation actions addressing the threats to blue carbon ecosystems at every level, from local to global, is required. Nature shows it thrives in diversity and this is no exception for approaches to blue carbon. We need an intersectoral and inclusive approach to craft long-term systemic impacts.
Recommendations to catalyze blue carbon solutions
Conserve - Coastal ecosystems must be conserved before full restoration can take place or they will emit and continue to emit high amounts of carbon from degraded areas and drained soils. These emissions will continue even if external threats to these ecosystems are addressed. Tactics include: expanding protected areas, limiting external threats (including ecosystem conversion for development/logging/aquaculture, pollution and industrial contamination, desalinization, unsustainable/ destructive fishing and upland drainage).
Involve community - Enforce land-use laws by increasing community capacity for commons management.
Restore - restore coastal blue carbon ecosystems for optimal co-benefits
End the exploitation - Expand protected areas for marine mammals and end whaling.
Reduce demand - Transform global protein demand from fish stocks and climate-intensive land-based proteins to proteins produced with restorative methods (e.g., macroalgae production, whose dry weight matter can be 10–30% protein, in tandem with bivalve/shellfish mariculture, ecological aquaculture farming, integrated seawater agriculture systems).
Feed people, not profit - Industrial fishing today is dominated by high income countries with “97% of the trackable industrial fishing on the high seas and 78% of such effort within the national waters of lower-income countries.”[1][Note: For this and subsequent footnotes on this page, please find the complete citations in Footnotes.]
Additionally, 90% of the fish used for purposes other than for direct human consumption (DHC) (e.g., fish feed for aquaculture systems) comes from food grade fish[2]. We should transition from a mindset of fueling optimal profit to one of producing enough food for everyone, with an emphasis on the world’s poor first.Fund Additional Research - Fund additional research to clarify carbon storage and carbon burial rates for seagrass ecosystems that will reduce the costs of restoration and thereby realize the full impact of coastal and oceanic blue carbon
How To Activate a Blue Carbon Mass Mobilization
GUIDING NATURE-INSPIRED PRINCIPLES
❏ Grow New Biomass
A source of most rapid carbon gains, biomass can be used to immediately benefit communities via food, fiber and fuel production.
❏ Stack In Benefits
Build in political regulation, community engagement, local restorative food, fuel and income generation, ecosystem restoration, conservation etc. with each project. Ecosystems whether existing or restored are best managed when they are integral to the health of local communities.
❏ Stakeholder Engagement
Consider at every level (beyond mere financial involvement).
STEPS
1. Demonstrate viability of blue carbon projects through a network of projects.
2. Fully integrate blue carbon initiatives into existing and new policy
3. Ensure projects have excellent management protocols: clear and implementable
4. Define clear project methodology
Blue Carbon Defined
Blue carbon refers to carbon stored and sequestered in marine environments and includes the carbon fixed in coastal blue carbon (mangroves, seagrasses, macroalgae and salt marshes) and oceanic blue carbon (phytoplankton, marine animals, and other open ocean biota). The relationship of the ocean to the carbon cycle involves a series of complex interactions that result in carbon being taken out of the atmosphere, respired back to the atmosphere, stored in the water as dissolved carbon and sometimes stored for thousands (or many more) years in coastal and deep sea sediments.
Marine phytoplankton and other marine microorganisms perform half of all photosynthesis on Earth (about 50 Pg C per year)3. Through gravity, food web interactions and mixing of water, this carbon slowly descends out of the range of sunlight; however the majority of this sinking carbon is consumed, respired (or remineralized) back to the atmosphere in short order. Only about 1%, a still significant 0.2–0.5 Pg C per yr, of the surface production finally reaches the seafloor for long term storage. Mechanisms to stimulate greater primary production of phytoplankton or increase marine vertebrate populations to capture, store and sink more of the photosynthetic production of marine phytoplankton are the key to deep sea sequestration and make up the majority of oceanic blue carbon solutions.
Coastal blue carbon ecosystems capture and store carbon through primary photosynthesis (storing carbon in soil and above ground biomass), capturing carbon in runoff from the land and, the most important part of the process, ‘exporting’ m) carbon to deep sea sediments when, for instance, certain biomass gets cut off or removed from the primary ecosystem. Remarkably, the carbon storage capacity of coastal blue carbon ecosystems is exceptional compared with the open ocean or terrestrial forests. Despite tidal marsh, mangrove, and seagrass ecosystems occupying less than 0.2% of the seabed area, they contribute nearly 50% of the CO2 sequestration in marine sediments, and their carbon sequestration rates exceed by 30 to 50 times those in the soils of many terrestrial ecosystems[4],5,6. At a global scale, coastal blue carbon ecosystems sequester 130–490 Tg C/yr, equivalent to 1%–5% of current CO2 emissions from fossil fuel combustion[7]. It is estimated that 41-278 Tg C/yr of the anthropogenic carbon released into the atmosphere comes from the degradation and disturbance of blue carbon environments and ecosystems, leaving humanity with the pressing opportunity to regenerate blue carbon ecosystem health while sequestering carbon dioxide[8].
Impact and Importance to Funders
Carbon Potential: Carbon Cycle and Global Warming
Coastal Blue Carbon Sequestration is made up of mangroves, seagrasses, saltmarshes and kelp/macroalgae: Although regional nuances influence the rate of carbon sequestration, according to Atlas of Ocean Wealth, coastal wetlands sequester enough carbon CO2 to offset the burning of over 1 billion barrels of oil (Spalding, 2016)[9]. This is an active field with frequent new research being published.
Mangroves are a type of tropical forest, found at the edge of land and sea and flooded regularly by tidal water. Mangroves can sequester between 1.6 to 2.2 Mg C/ha/yr (tons of C per hectare). Mangrove ecosystems could store as much as 20 Pg of carbon—equivalent to more than 2 years of global carbon emissions—in their soils, much of which would be released into the atmosphere if the trees were destroyed (Sikamaki et al, 2012)[10].
Seagrasses are submerged coastal marine vegetation living in shallow waters (neritic zone) with an underground network of rhizomes. Seagrass soils have the potential to sequester 1.38 Mg C/ha/yr. More recent analysis suggests seagrass may have even a greater role of exporting (during storm events for example) carbon material out to deep sea that sinks to depths where it becomes part of the ocean floor sediment[11]. Although a challenging ecosystem to study, one report estimates that global carbon pools could range from 4.2 Pg–19.9 Pg organic carbon (Fourqurean, 2012)[12].
Salt Marshes – Saline tidal marshes store carbon in the marsh soil. Tidal salt marsh soils can be many meters in depth and represent a significant stock of organic carbon. The average carbon sequestration rate for tidal marshes averages between 1.6 to 2.2 Mg C/ha/yr. These rates are about two to four times greater than those observed in mature tropical forests.
Kelp/Macroalgae – Until recently it was thought that coastal macroalgae stands sequester carbon when they grow, but when material is shed it would be consumed and respired back to the atmosphere. New research in the last couple of years suggested that up to 30% of net primary productivity of kelp growth may be exported to the deep sea for deposition and long term sequestration, putting this ecosystem and methods such as regenerative ocean farming or kelp reforestation more squarely in the Blue Carbon field[13].
Oceanic Blue Carbon Sequestration: Although the majority of literature, projects, funding and organizations identified as Blue Carbon is associated with Coastal Blue Carbon, the open ocean and the full water column to the seafloor has significant influence on the global carbon cycle. Ocean dynamics known as the solubility pump and the biological pump exchange carbon with the atmosphere through complex systems of interaction. The biological pump takes photosynthetically-produced organic matter and exports it in part from the surface layer to depths that effectively sequesters the carbon in the material for millenia by a combination of sinking particles, vertical mixing of dissolved organic matter, and transport by animals[14].
Planktonic algae in open ocean also plays a role in the global carbon sequestration cycle, sequestering 9.9 Pg C/yr via photosynthesis, of which 0.14Pg C/yr ends up in deep ocean sediment carbon stocks (Spalding, 2016)[15].
A number of mechanisms influence the biological pump that humans may potentially in turn influence through our behavior and disturbance.

FIGURE 1: Oceanic Blue Carbon Mechanisms from Grid Arendal. Note 6, Great Whale Conveyor Belt, excluded from table of definitions.
A simplified analysis was done to measure the relative reportive impact of these mechanisms (where C sequestration potential data was reported by Grid Arendal.
When considered with current understanding, Coastal Blue Carbon ecosystems and associated Blue Carbon mechanisms are the priority focus. Coastal Blue Carbon ecosystems influence Oceanic Blue Carbon mechanisms by stimulating the biological pump as critical breeding habitat for marine vertebrates (fish, turtles, etc.) who play a role in the biological pump (see, for example, this article on impact of fish stocks).
![FIGURE 2: (https://cld.bz/bookdata/WK8FNPt/basic-html/index.html#39 - Grid-Arendal[16])](https://images.squarespace-cdn.com/content/v1/5b12e00d365f022327288477/1572719548338-WI7TNZCGC8AIW0B6LM7B/Blue+Carbon+Figure+2.png)
FIGURE 2: (https://cld.bz/bookdata/WK8FNPt/basic-html/index.html#39 - Grid-Arendal[16])
Co-Benefits of Coastal Blue Carbon
Similar to how tree-planting campaigns can have adverse impacts when conducted without local community control and skillful ecological oversight, so too can Blue Carbon initiatives. The Blue Forests Project has developed a Blue Carbon Code of Conduct which prioritizes community decision-making, agency of indigenous communities and protecting human rights. The code recommends adopting a lean, cost-effective and iterative approach that prioritizes learning from on-the-ground results and pilot projects rather than drawn-out and costly planning processes. Thus, when blue carbon projects are executed effectively and comprehensively co-benefits can be achieved including coastal protection from extreme weather events, improved sea level rise adaptation, pollution mitigation/ nitrogen cycling, jobs & co-products and increased Fish Stocks, oxygenation of coastal waters, nurseries for helping to restore world fish stocks.
Funding Blue Carbon
Blue Carbon projects (conservation, restoration or other) appear to receive a minority of global philanthropic funding associated with the one world ocean and ocean environments. FundingtheOcean.org (Foundation Maps by Candid) lists $8.3 Billion total dollar value from 51,412 global grants towards the ocean from 2009-2019. The number of of global grants to Blue Carbon related initiatives from 2009–2019 totaled 175 (0.34% of total grants toward the ocean) for $20,000,000 total (0.24% of total giving toward the ocean).

FIGURE 3: Amount of Blue Carbon Grants.
A separate analysis of data provided by CEA Consulting showed 317 grants from 2004–2017 broadly classifiable as Blue Carbon initiative support for $57,395,198 total.

FIGURE 4: Grant Amounts per BC Ecosystem.
Some patterns appear to be clear:
A small percentage of philanthropic funding for oceans and ocean health has been allocated to Blue Carbon initiatives or projects identified as Blue Carbon related
Mangroves receive the majority of Blue Carbon funding
Not including conservation costs (creating MPAs, etc.) but only considering active restoration and creation of certain Blue Carbon ecosystems shows a need for between $425 Billion to $60 Trillion (USD) to achieve total potential impact. This cursory analysis also points to some critical needs for funding to reduce the average cost of restoration and creation and to better understand how natural (not active) revegetation might occur from protection and conservation (to reduce the total cost). Current philanthropic giving needs to be catalytic to larger pools of resources as the total philanthropic given to oceans is a couple of orders of magnitude too little to fully resource Blue Carbon Ecosystem restoration and protection.
Strategies for Rapid Acceleration

PHOTO CREDIT: Shane Stagner
Not all potential blue carbon ecosystem improvements are self-evidently ready for action for enhancing carbon capture and ecosystem health. This is not to say that all potential blue carbon ecosystem improvement initiatives are not worthy of attention and action, but not all share the same degree of readiness for acceleration of carbon capture and storage.
Lovelock, et al., provide the best and most up to date analysis of readiness to be considered “actionable” blue carbon ecosystem initiatives. The analysis demonstrates a bias for action in coastal environments—seagrass, mangrove, tidal marsh, and macroalgae ecosystems.

Figure 5. Criteria for Inclusion as Actionable Blue Carbon Ecosystems. Note: Data from Lovelock CE, Duarte CM. 2019 Dimensions of Blue Carbon and emerging perspectives.
Despite the importance of blue carbon ecosystems and their outsized impact on the global carbon cycle, until recently they have received little popular attention or focus from the philanthropic and investment community. While terrestrial rain forests are receiving ever higher levels of attention, the world is losing its coastal habitats at four times as fast a rate[17]. This differential in attention is sometimes referred to as a “charisma” gap. Regardless of the losses, action is being taken to conserve, protect and restore these coastal ecosystems. For example, worldwide there are some 2500 protected areas which include mangrove forests within their boundaries. These include some 54,000 km2, or over 39% of the world’s remaining mangroves[18][19]. Ecosystem loss in these protected areas is dramatically lower than in those areas not protected.
The literature predominantly puts an emphasis on the priority of conservation and protection of remaining coastal blue carbon ecosystems and these conservation mechanisms are often erroneously conflated with mechanisms for restoration and/or creation.

Table 2. High Level Table of Blue Carbon Strategies.
The series of interviews accompanying this report as well as the literature point towards specific key blue carbon ecosystems and specific mechanisms and techniques as potentially providing the highest leverage for rapid acceleration and greatest beneficial impact. These include:

Table 3. Select blue carbon ecosystems, mechanisms, and techniques potentially providing the highest leverage for rapid acceleration and greatest beneficial impact.
Mangroves
A mangrove is “a woody tree or shrub that lives along sheltered coastlines within the tropic or subtropic latitudes.” The term is also used to refer to mangrove forests, where foliage on land provides a habitat for other plants and animals, and under water their complex branching root system provides shelter and nesting grounds for many fish. Mangroves are an extremely effective ecosystem for carbon capture and storage, due to their ability to sequester atmospheric CO2 and store it in organic soils and biomass for thousands of years, stable and undisturbed.

Table 4. Mangroves and Carbon – The Stats. Note: Data for mangrove carbon stats from Worthington, T., & Spalding, M. (2018). Mangrove Restoration Potential: A global map highlighting a critical opportunity.
Mechanism: Restoration
Globally, 8,120 km2, or 6% of former mangrove areas are considered restorable according to the Mangrove Restoration Potential Report, supported by The Nature Conservancy, IUCN, and the University of Cambridge. Of the land lost, 81.7% is considered highly restorable, making these locations prime locations for successful blue carbon initiatives.
Priority Areas: The level of restorability is based upon the restoration potential score, an expert-derived model for ‘restorability’ determined by key environmental components that influence the ease of restoration. Areas with a restoration potential score of 60 or higher, based on a scale from 0–100, are considered highly restorable. Notable factors taken into consideration include sea level rise, tidal range, time since loss, and the average size of loss. The analysis makes clear that the restoration potential score is only a starting point and is unable to account for localized activity such as political, social and economic drivers, along with localized ecological and geological factors.

Table 5. Mangrove Restoration Areas. Note: Data for mangrove carbon stats from Worthington, T., & Spalding, M. (2018). Mangrove Restoration Potential: A global map highlighting a critical opportunity.

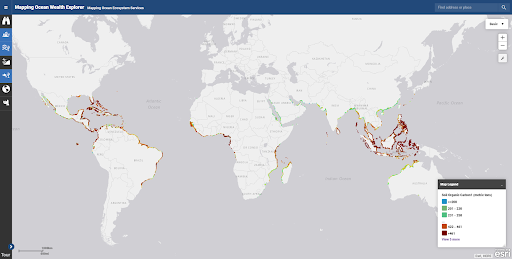
Figure 6. Map of the Total Restorable Area of Mangroves Colored by Restoration Potential Score. To view an interactive version of this map and see more in-depth statistics by country, visit Mapping Ocean Wealth Explorer, an interactive mapping tool of marine and coastal ecosystems provided by the Nature Conservancy.
Not all mangrove typologies have the same restoration capacity or priority for ecosystem improvement initiatives. Some research indicates that overall, mangroves in deltaic coasts such as the Mississippi River delta, the Amazon in Brazil and the Sundarbans in India and Bangladesh can sequester more carbon yearly than any other aquatic or terrestrial ecosystem on the globe. These can be considered the world’s blue carbon hot spots.
That said, others have assessed, in detail, particular regions in the world where mangrove restoration is most feasible for greatest carbon impact over the greatest area[20]. The most recently provided estimate of total global area of mangroves is 136,714 km2, based on 2016 data. Almost 90% of the world’s restorable mangroves are located in 24 countries. Addressing the top five countries alone would include 56.5% of mangroves that can be restored.

Table 6. Restorable areas for selected countries with the largest extents or with a high proportion of restorable mangrove area. Note: Data for mangrove carbon statistics from Worthington, T., & Spalding, M. (2018). Mangrove Restoration Potential: A global map highlighting a critical opportunity.

Table 7. Countries in the world with the highest total potential in terms of restorable above-ground biomass and soil carbon. Note: Data for mangrove carbon statistics from Worthington, T., & Spalding, M. (2018). Mangrove Restoration Potential: A global map highlighting a critical opportunity.
Best Practices For Successful Mangrove Restoration Projects[21]
Understand the ecology and hydrology of the land.
Have local community engagement and support.
Establish clear responsibility and management of the project site.
Incorporate policy to ensure long-term success and prevent relapse.
Address causes of degradation and natural impediments to mangrove settlement and growth to allow for natural regeneration.
Improve land-use practices to decrease nutrient and sediment run-off.
If propagules are limited, plant mangrove seedlings and propagules to accelerate recovery.
Hydrological restoration is recognized as the most successful and cost-effective restoration approach and includes:
Restoring tidal hydrology through excavation or back‐filling.
Reconnecting blocked areas to normal tidal influences.
Restoring hydrological regimes and sediment flow to ensure access to freshwater and sediments which help mangroves keep up with changes in sea level and support carbon sequestration.

Mechanism: Conservation
If mangroves are not conserved and are cleared from the land, we further propel global warming as soil carbon begins to decompose and living biomass carbon is swiftly converted to CO2 and released into the atmosphere.
Protected Areas: Assign Responsibility: About 60% or 82,714 km2 of the world's remaining mangroves are not under protected areas according to the World Database on protected areas (Worthington & Spalding).
Minimize Threats from External Environment: Within protected areas, degradation can be minimized but activities occurring outside and adjacent to protected areas can still potentially harm protected mangroves and thus should also be monitored and minimized. Threats to look out for include:
Upstream water abstraction
Sediment supply changes
Coastal erosion
Remote coastal engineering
Sea level rise


Seagrass
Seagrasses are common and form meadows in coastal environments, typically in very shallow waters down to 60 m depth. They occur in many areas of the world, but mainly in tropical Atlantic and tropical Indo-Pacific waters.

Table 8. Seagrass Area by Global Regions. Note: Data from Unsworth, Richard KF, Len J. McKenzie, Catherine J. Collier, Leanne C. Cullen-Unsworth, Carlos M. Duarte, Johan S. Eklöf, Jessie C. Jarvis, Benjamin L. Jones, and Lina M. Nordlund. "Global challenges for seagrass conservation." Ambio 48, no. 8.
Some 30% of seagrass ecosystems have been lost globally over the last 50 years.
Seagrass and Carbon: The Stats
Globally, seagrass ecosystems could store as much as 19.9 Pg/C
The current seagrass carbon pool lies between 4.2 and 8.4 Pg/C[24]
When healthy and not overgrazed, seagrass soils have the potential to sequester 1.38 Mg C/ha per year.
Priority Locations
For seagrasses, factors that affect carbon sequestration include water depth, turbidity, and other habitat variables. Priority for conservation and restoration should be given to large persistent species in shallow/low turbidity areas. Areas where coastal fishing communities can perform the active restoration and/or engage in co-managed conservation should be prioritized. Countries with active efforts include Madagascar, Malaysia, Indonesia, Mozambique, Solomon Islands, Sri Lanka, Vanuatu and Abu Dhabi.
It should be noted that in the case of restoration, a time lag of 10–20 years might be required to achieve carbon accumulation rates comparable with natural seagrass meadows.
Benefits
In addition to being a carbon sink, seagrasses provide a number of additional co-benefits. When not overwhelmed by eutrophication or coastal pollution, seagrass can utilize coastal runoff nutrient and mitigate eutrophication. Recent estimates suggest seagrass meadows support the productivity of 20% of the world’s biggest fisheries through nursery habitat provision[25]. Wherever they are present in proximity to human populations they form a targeted fishing ground of significant importance to human livelihoods and well-being[26]. Seagrasses also provide key habitats for keystone species such as sea turtles.
Mechanism: Conservation, Restoration and Creation
Although there remains uncertainty on the total extent of global seagrass ecosystems, modeling has been developed that estimates the following potential for interventions:
35 Mha of existing seagrass can be protected through seagrass conservation
14.2 Mha of seagrass ecosystem, lost to degradation in the last 100 years, can be restored through seagrass restoration
143 Mha of potential habitat that could be suitable for seagrass can be planted through seagrass creation
The priority focus is seagrass conservation and restoration.
Techniques
Seagrass conservation practices are similar to the practices utilized in mangrove settings. Examples of notable successful conservation sites include small community led marine protected areas (MPA) (e.g., in Tolitoli and Baru Baru) and MPAs focused on protecting keystone species such as dugong (e.g., in Bintan). Conservation incentive schemes (e.g. community-led efforts to reforest degraded riparian vegetation such as in Wakatobi NP) are also indicated in certain regions.
Seagrass restoration presents certain challenges and opportunities regarding cost and survival rates. According to the most widely cited resources for costs of blue carbon ecosystem restoration, seagrass ecosystem total restoration costs average $383,672/ha (2010 USD). This is likely a high estimate, especially given a median survival rate of 38%. Recent exercises using volunteer manual planting are far cheaper at $16,000–$34,000/ha, depending on plant unit spacing. The same planting using paid labor ranges from $84,000 to $168,000/ha[27].
Specific techniques and practices have been tested to reduce costs and increase survival rates, but their application is not yet a widespread practice. Best practices for seagrass restoration include[28]:
Plant enough plants or seeds (between 1000 and 10,000 shoots/seeds at a minimum) for effective survival and population growth rate.
Carefully select sites and species,for instance, a sheltered location with adequate light. Priority areas include shallow neritic zone areas that are less affected by pollution and/or areas where a complementary pollution mitigation strategy is being applied, such as a pollution biofiltration technique.
Remove existing threats prior to replanting, e.g. controlling pollution, dredging.
Prioritize water quality in restoration plans. Poor water quality is a leading cause of restoration failure.
One particular study of importance used biodegradable hessian bags (burlap sacks) partially filled with sand as a means of distributing seagrass plugs. Economically, hessian bags appear to be a sound option for large-scale rehabilitation. Materials are inexpensive and sites can be established by simply throwing bags off a boat as opposed to transplanting which is slow and costly to establish, requiring expensive divers and specialist expertise to cover a much smaller area per unit time. Cost-benefit analyses for large-scale rehabilitation indicate that a sowing density of 1000 hessian bags/ha would cost $16,737 (includes cost of materials, construction, and deployment), whilst covering the same area using transplants would cost at least $27,593[29].
Another paper identified clear increased survival rates (doubled) associated with a critical mass (minimum of between 1000 and 10,000 shoots/seeds) of planting[30]. The larger initial number of number of transplants were more resistant in the long term.
Fishing community-led efforts, using some form of hessian bag methodology, clustered for resilience, and observing the aforementioned best practices are best positioned to restore seagrass ecosystems for optimal cover, lowest cost and greatest co-benefits.
Ocean Farming
Recent analysis shows that as much as 30% of net primary production from growth of macroalgae is exported to deeper marine sediments where the carbon in these seaweeds becomes sequestered over long timeframes[31].
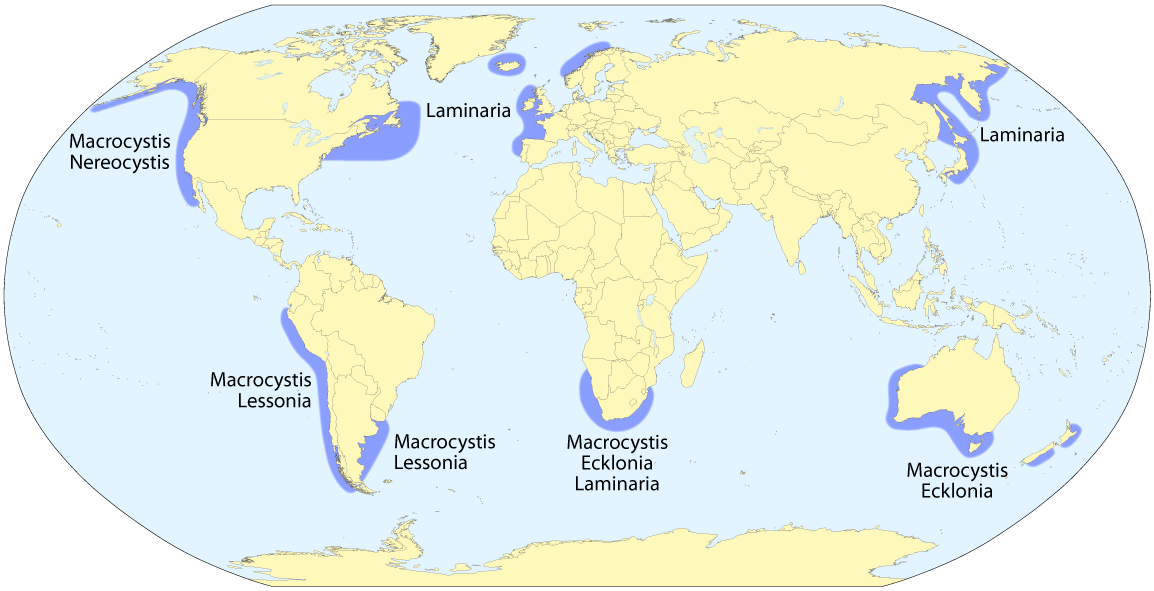
Many coastal regions have the potential for extensive macroalgae reforestation and ocean farming. Those areas with economically depressed coastal fishing communities would be the highest priority locations. See map below for certain highly suitable areas.

FIGURE 7: High likelihood areas for natural seaweed production, brown for brown seaweeds, red for reds. Greens will generally grow in the same areas as browns. It should be noted that this method of identifying high likelihood areas is not exhaustive. Seaweeds are grown in many areas outside of those indicated and many sites within identified high likelihood areas will not be suitable.56 See map below for certain highly suitable areas. Note[32]: Data from Yarish, C., Brummett, R., (Eds.) (2016). Seaweed Aquaculture for Food Security, Income Generation and Environmental Health in Tropical Developing Countries. Technical Report.
Ocean Farming and Carbon: The Stats
The World Bank estimates the following impact from expanded seaweed farming over the next thirty years. While global seaweed production in 2012 was three million tons dry weight and growing at a rate of nine percent per year, increasing seaweed farming to 14% growth per year would generate 500 million tons dry weight by 2050[33]. Market development for potential uses for seaweed is critical to increase adoption of ocean farming[34].

Figure 8. Extrapolated ecosystem services from 500 million tons (dry weight) of seaweeds. Note: Data from Yarish, C., Brummett, R., (Eds.) (2016). Seaweed Aquaculture for Food Security, Income Generation and Environmental Health in Tropical Developing Countries. Technical Report.
According to Project Drawdown, the food sector’s potential to mitigate current contributions to global warming[35] comprises one third of the plausible scenario for reversing global warming. Thus, macroalgae’s biggest contribution to rebalancing the carbon cycle may be via mitigating the emissions from other terrestrial agriculture activity, for instance by replacing carbon-intensive fertilizers and food products. Apart from mitigation, macroalgae, when not fully harvested, contribute to carbon burial when portions of the biomass is sequestered in long-term sediment storage[36] and foster soil carbon increases in terrestrial soil when used as an agricultural amendment with other soil-building practices (for instance, reduced tillage).

Integrated Seawater Agriculture Systems (ISAS)
ISAS is a method of selecting halophytes (salt-tolerant flowering plants) and intentionally cultivating them in desertified, degraded or desert soils by introducing saline irrigation, for instance “ocean rivers”, to inland soils. This method of creating blue carbon habitats might be considered controversial due to the appearance of large-scale ecosystem manipulation.
ISAS methods have been piloted in Eritrea, Mexico and Egypt. Globally, the range of ecosystems suitable for ISAS include coastal deserts, inland salt deserts and regions where salinization has occurred due to industrialized agricultural practices otherwise known as “secondary salinization.” According to a 2006 report, secondary salinization has spread to one billion hectares globally and is increasing at a rate of two million hectares annually. An estimated 130 million hectares may be immediately available for halophyte cultivation[37].
ISAS and Carbon: The Stats
According to the same report, halophyte production in a potential 130 Mha area has the capacity to assimilate 0.6–1.2 Pg of carbon per year, sequestering 30–50% of this carbon in long-term soil carbon. Coupling with nitrogen-fixing salt-tolerant plants such as Prosopis or Acacia spp. could increase sequestration in soil carbon even further by two T/ha and grasses such as Panicum vergatum (or switchgrass) grown on degraded soil has been shown to increase soil carbon by 12% over 10 years[38].
Carl Hodges and Arthur Gensler of Seawater Works have explored partnerships with the Cucapah Indians of Mexico to apply this technology by bringing seawater through the Salton Sea of California, travelling through Mexicali and the Imperial Valley along the way. Other priority locations include India, Morocco, Pakistan, and the countries of the Middle East and North Africa.
ISAS systems can be utilized for production of shrimp, tilapia, salicornia (pickleweed) and mangroves. These species produce a host of products including proteins, oils, fuel, habitat and improve soil carbon. Salicornia, being a dense carbohydrate, can also be turned into sturdy building materials. The dense groundcover cools local climates and builds soil carbon. Other uses include medicines (for such ailments as digestive troubles and heart disease), fuel wood and timber, forage/fiber, chemicals (such as soda for soap-making and glass) and landscaping[39].
While this technique is still in a research and development phase, the potential boon to food security in very specific regions (i.e. coastal areas that are desertified and/or food insecure like California), makes this an attractive and potentially cost-effective strategy to explore. The blue carbon literature and funding sources largely overlook this mechanism.
Biomixing Whale Pump
Whales are creatures of the open ocean and although whales are found widely throughout the world’s oceans, most species prefer the colder waters of the northern and southern hemispheres, and migrate to areas closer to the equator to give birth. Once relentlessly hunted, whales are now protected by international law which is not always enforced or enforceable.
Whales carry nutrients such as nitrogen from the ocean depths back to the surface. When whales (and other mammals with similar depth feeding and surface defecation patterns) defecate at the surface their liquid faeces, rich in iron and nitrogen, feed phytoplankton. The southern ocean is an example of a high nitrate low chlorophyll (HNLC) region. In these regions of the ocean, the limiting factor to the growth of phytoplankton and other micro-life is nutrients such as iron. Increasing the population and activity of whales in these regions could stimulate phytoplankton growth, some of which would be exported to the deep sea as sequestered carbon.The total potential impact of this nutrient provision is not well understood. The factors that need to be understood to develop an accurate estimate of their impact would include total current whale population (estimated at 10% of pre-commercial whaling population), growth of population, identification of defecation patterns and regional residence time for each species, the iron content of the diet of each type of whale and the export rate of phytoplankton to the deep ocean in each region.

![Figure 9. This map visualizes a number of areas of the ocean that are known as HNLC regions, where increasing the population and activity of whales could stimulate phytoplankton growth[40]. Note: From Galbraith, E. D., Le Mézo, P., Bianchi, D., &…](https://images.squarespace-cdn.com/content/v1/5b12e00d365f022327288477/1572734526347-PNBURFRFZ6293PKWROF6/Blue+Carbon+Figure+9.png)
Figure 9. This map visualizes a number of areas of the ocean that are known as HNLC regions, where increasing the population and activity of whales could stimulate phytoplankton growth[40]. Note: From Galbraith, E. D., Le Mézo, P., Bianchi, D., & Kroodsma, D. (2019). Growth limitation of marine fish by low iron availability in the open ocean. Frontiers in Marine Science, 6, 509.
Whales are charismatic animals and linking them with carbon sequestration in popular discourse could stimulate increased emotional connection to blue carbon. Restoring whale populations implies protecting whales and whale habitat which would have co-benefits of increased fisheries and other cascading impacts on the carbon cycle.
Whales continue to be threatened by killings, captures, bombings, plastic ingestion, and pollution. Creating more MPAs, reducing plastic debris and reducing chemical, oil and sonic pollution all are effective means for increasing whale population and health.
About "Geo-Engineering and Other Strategies
Based on actionable criteria referenced above by Lovelock, et al., this report focuses on potent and sometimes novel approaches within mostly conventional blue carbon mechanisms. Additionally, the report considers and assesses mechanisms for climate change mitigation known as geo-engineering.
The spider chart below from Gattuso, et al.[41] explains the readiness and durability of other, ocean-based strategies being examined and developed.

Figure 10. Assessment of ocean-based measures to address key ocean drivers. Scores 1 to 5: very low, low, moderate (thicker circle), high, and very high. Note: Figure from Gattuso, J. P., Magnan, A.(Eds). (2018). Ocean solutions to address climate change and its effects on marine ecosystems. Frontiers in Marine Science, 5, 337.

Figure 11. Potential ocean solutions. Four main groups are considered: addressing the causes of climate change (i.e., reducing anthropogenic greenhouse gas emissions or increasing the long-term removal of greenhouse gases, primarily CO2), solar radiation management, protection of biota and ecosystems (habitats, species, resources, etc.), and manipulation of biological and ecological adaptation. Note: Figure from Gattuso, J. P., Magnan, A.(Eds). (2018). Ocean solutions to address climate change and its effects on marine ecosystems. Frontiers in Marine Science, 5, 337.
Of particular note are strategies to increase net primary productivity of phytoplankton. Due to the charisma of marine megafauna like whales and significant co-benefits associated with their preservation, this report has featured the biological mechanism of whale pump and biomixing, with noted potential limitations of carbon effect.
Ocean fertilization, the use of iron or other mineral nutrients to stimulate net primary productivity, has received much attention. Adding material to the ocean is potentially considered pollution and ocean fertilization is prohibited (except for research purposes by the London Convention and the London Protocol). The main arguments against fertilization include ecological risks (uncertain and unintended effects on biological life and food webs other than phytoplankton) and the scale and duration of fertilization activity. An assessment framework has been developed for future research.
Alkalinization also receives considerable attention. This mechanism involves adding carbonate material (examples include limestone and olivine) to the ocean to reduce acidity, which would enable the ocean to absorb additional carbon from the atmosphere. Critics have expressed concern about the emissions footprint of mining and transporting alkalizing land material to the ocean weighed against its carbon capture potential. This mechanism is particularly interesting because of the co-benefits of reducing acidification of the ocean. As of yet, there is no reasonable scale testing and measurement of the net benefits from this mechanism. Of particular note is Project Vesta - focused on olivine weathering.
Blue Carbon Projects
Where Are Coastal Blue Carbon Ecosystems?
![TABLE 9. Known global extent and distribution of blue carbon ecosystems.[42]](https://images.squarespace-cdn.com/content/v1/5b12e00d365f022327288477/1572816409560-V4I6LNH5G9WV87M48TTC/Blue+Carbon+Table+9.png)
TABLE 9. Known global extent and distribution of blue carbon ecosystems.[42]
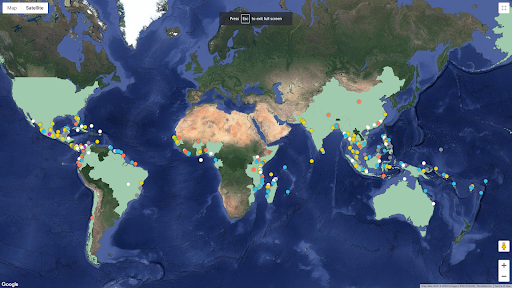
Visual Landscape of Projects
A collaborative mapping project for cooperative input of identified blue carbon projects has been created as a by-product of the current report. We expect the following map to be updated regularly and provide a reference source for general use and distribution to projects around the globe.
While blue carbon funding has been steadily increasing (and the known dataset has likely not captured the entirety of these increases), based on the CEA data reviewed comprising an analysis of 317 grants from 2009 through full-year 2016, and partial years 2017 and 2018, the following geographical focus of funding was identified:

TABLE X: This map visualizes a number of areas of the ocean that are known as HNLC regions, where increasing the population and activity of whales could stimulate phytoplankton growth. Note: From Galbraith, E. D., Le Mézo, P., Bianchi, D., & Kroodsma, D. (2019). Growth limitation of marine fish by low iron availability in the open ocean. Frontiers in Marine Science, 6, 509.
Funding Gaps
Blue carbon projects (conservation, restoration or other) appear to receive less than a quarter of one percent of global philanthropic funding associated with ocean and ocean environments. FundingtheOcean.org (Foundation Maps by Candid) 68 lists $8.3 billion total dollar value from 51,412 grants given globally for oceans and ocean environments from 2009–2019. Using query terms common to blue carbon ecosystems, the number of global grants to blue carbon related initiatives from 2009–2019 totaled 175 and $20,000,000 (0.24% of total giving for oceans). For comparison “coral” totals 2,004 grants for $206,100,000.
A separate analysis of Funding The Ocean data analyzed by CEA Consulting has identified those grants that had been previously tagged by CEA staff during review as relating to blue carbon and those grant descriptions which contained “blue carbon,” “mangrove,” “seagrass” or “coastal wetland.” This analysis showed 317 grants from 2004–2017 broadly classifiable as blue carbon initiative support for a total of $57,395,198.
Some patterns clearly appear:
Only a small percentage of philanthropic funding for oceans and ocean health has been allocated to blue carbon initiatives or projects identified as blue carbon related
Mangroves receive the majority of blue carbon funding
In order to gauge the amount of resources potentially needed to significantly scale up blue carbon a simplified analysis was done looking at a few key blue carbon ecosystems, their potential for restoration and creation (does not include protection and conservation of existing extent) and the average cost (and average low cost) for acting on restorable extent.
Funding Mechanisms
Financing blue carbon project implementation at scale remains the most difficult task for achieving conservation and restoration objectives and the investment mechanisms and desire to finance projects remain inadequate. There are a diversity of multilateral and national funds that could possibly finance blue carbon strategies. Philanthropy and debt purchasing or conversion are non-market, non-multilateral or national fund mechanisms that play a critical role in developing pilot projects that prove the funding hypothesis for the investment of larger pools of capital and the use of market-based mechanisms. Carbon markets (voluntary and regulated) are still at an emergent stage, but are showing promise (e.g., see Seagrass Grow as of Sept. 2019—335,222 sq ft of seagrass planted).
Additional Research Needed
Macreadie, Peter I., et al. have identified a ten-point roadmap for continued research in blue carbon. Of these ten research areas, four align with the highest potential for actionable carbon sequestration:
1. How does climate change impact carbon accumulation in mature blue carbon ecosystems and during their restoration?
2. What is the global importance of macroalgae, including calcifying algae, as blue carbon sinks/donors (i.e., does macroalgae carbon biomass become respired back to the atmosphere or how much
of the production becomes long term carbon storage as sediment on the seafloor)?
3. What factors influence blue carbon burial rates?
4. What management actions best maintain and promote blue
carbon sequestration?
How does climate change impact carbon accumulation in mature blue carbon ecosystems and during their restoration?
Some hyperbolic claims are made that, due to sea level rise, all coastal blue carbon projects and initiatives will be for naught. The argument is that the rate of sea level rise will soon be greater than the rate of material deposition and therefore all coastal blue carbon ecosystems will become open ocean/water ecosystems. Research indicates the story is much more nuanced and this outcome is not inevitable. Historically, observations of widespread wetland drowning are infrequent due its ability to actively engineer its own positioning and self-stabilize based on changing conditions. Whether they continue to survive ever faster rates of sea level rise is unclear and vulnerability may even be overestimated; yet modifiable human behavior is a key determinant of how effectively and quickly wetlands can continue to adapt.
People
Fish
Carbon fertilization
What is the global importance of macroalgae, including calcifying algae, as blue carbon sinks/donors?
Macroalgae are highly productive and occupy the largest global area of any vegetated coastal ecosystem, yet only in relatively few cases have they been included in blue carbon assessments. A recent meta-analysis has estimated that macroalgae growing in soft sediments have a global carbon burial rate of 6.2 Tg C per year. This carbon burial rate occurs through as much as 30% of the primary production of kelp being naturally trimmed and exported via powerful ocean currents, which then deposit this excess biomass in deep ocean sediments and trenches. Krause-Jensen and Duarte’s synthesis of multiple studies shows that macroalgae currents control this deposition of excess biomass in carbon sinks well beyond macroalgae habitats.86 Determining specific mechanisms to enhance and increase carbon export from macroalgae stands to deep sea sediment should be an active area of research while simultaneously restoring macroalgae stocks through adoption of ocean farming.
A sub-theme of this research question should include how to catalyze increased macroalgae stocks by creating market demand for macroalgae via research on potential uses for seaweed and current opportunities for expansion. The Nature Conservancy and Encourage Capital have begun to address this by quantifying, for example, the growth of the food thickeners market, which increased by 342% from 2006 to 2016.87 Of course, this would require expanding macroalgae stocks sufficiently to both feed the market for seaweed consumption and increase deep sea carbon sequestration.
What factors influence blue carbon burial rates?
Specific project sites and regions show significant diversity in carbon burial rates within the same ecosystem type. Additional research on biogeochemical processes, temperature, hydrodynamics, biological actions and other factors that drive burial rates will help with carbon storage modeling and possibly prioritization of sites for restoration and conservation. This might involve researching specific species of seagrass or salt marsh vegetation or even mechanisms to modify or stimulate wave action or the location of high burial rate sites relative to other ecosystem features.
What management actions best maintain and promote blue carbon sequestration?
Developing and researching additional projects aligned with community-centered development that model practices of community inclusion and determination is critical. Technical, financial and policy barriers remain to be addressed before local initiatives can be scaled up to make large impacts—such as through national REDD + initiatives. This should also include research on how to reduce the costs and increase the co-benefits of restoration.
Blue Carbon Interviews
This chapter was informed by key interviews with the following leaders in the Blue Carbon space.
Bren Smith, Greenwave
Founder of Greenwave, former commercial fisherman turned ocean farmer
Gabriel Grimsditch, United Nations Environment Program (UNEP)
Program Management Officer with UNEP working to address the impacts of climate change on oceans
James Kairo, Kenya Marine and Fisheries Research Institute (KMFRI)
Pew Fellow 2019 and coordinator of Blue Carbon Unit at KMFRI to advise Kenyan government on the wise use of aquatic resources, including mangroves
Katie Lebling & Colin McCormick, World Resources Institute (WRI)
Researchers for WRI on the policy, cost and funding of brining blue carbon to scale
Lalao Aigrette, Blue Ventures
Deputy National Blue Forests Programme Lead who oversees the mangrove conservation, carbon projects, testing and viability of mangrove projects at a large scale
Murray Fisher, Billion Oyster Project
Founder of Billion Oyster Project and NY Harbor School
Ben Scheelk, Ocean Foundation
Senior Program Manager lead providing critical infrastructure and operational expertise to coastal and marine conservation projects
Priya Shukla, PhD Student at UC Davis
PhD student studying climate change, ocean science and food security
Sarah Myhre, PhD, Independent Oceanographer
Paleoceanographer and Kavli Fellow with expertise in social and ecological decision-making and climate
Sergio Ruiz, PhD, Save the Med
Marine Biologist focusing on carbon exchange between the atmosphere and water table
Steven Lutz, GRID Ardenal
Blue Carbon Programme Leader in support of UN Environment including Abu Dhabi Blue Carbon Demonstration Project and the GEF/UN Environment Blue Forests Project
Tim Flannery, Blue Carbon Initiative | Ocean Forests Foundation
Professor, chair and founder of the Ocean Forest Foundation
Tom Goreau, Global Coral Reef Alliance
Biochemist, founder of Global Coral Reef Alliance and author of many books including Geotherapy & Marine Ecosystem Restoration